Thursday, April 30, 2009

Thursday 04/30/09 - Caught up in the DOM

I'm still waiting for that one day when I'll have no distractions or technical problems throughout the trading day, and I'll be able to focus on just the market. I got up pretty early this morning to head to the condo (as mentioned in yesterday's post), and a few minutes after I left, I got a call from my contractor saying he will need to reschedule due to weather (did I mention how glad I am to NOT be in the construction business). I was actually glad since I could now spend the day trading. I was at the screens at 8:15 AM, and started placing trades around 8:40 AM. Unfortunately, TradeStation started having problems right from the open. Charts froze for a few minutes at the open. Then later on, I lost my tick-bar charts altogether. After that, the NYSE TICK data froze up. Then I lost data on XLF, the financial ETF. In the middle of all this, I received 7-8 phone calls regarding a property I'm selling, which is a good thing for the property sale, but a huge distraction for trading. So basically just problem after problem, and an extremely frustrating day. I was trading just off the 1 and 3 minute charts, and was up +$187.50 in the morning; missed a lot of trades, and took some bad ones since I didn't have the 610 tick chart, which is my primary execution chart. I kicked up the size a bit in the PM session and began trading 1-3 contracts. Ended the day up +$1,100 but I'm not really counting it since it wasn't on my typical 1-lot trade size. For the record, I hate trading 1-lots but I have to prove I can be profitable on 1 contract before I increase size (have traded up to 12 contracts in my real $ account in the past, but want to "earn" the size this time around).

As the title suggests, I lost discipline and got caught up in the action on the DOM (depth of market), and began scalping for quick 1-2 pt profits; at times just 2-3 ticks of profits. Perhaps this was because my charts were barely functioning today, or maybe I just got caught up in price moving so quickly on the price ladder (Infinity's platform is super fast!), and started going for quick momentum trades. I don't know. Whatever the reason, it's not how I normally trade, and despite the gain today, I would grade my trading as a "C-" since I didn't stick to my plan in the afternoon, cut too many winners short, and scalped way too much (40+ trades today).

As of now, looks like I'll be at the condo tomorrow morning at 8:30 AM, unless it rains again, so no trading for tomorrow. A one-day break is probably a good thing on this end.

ES/$TICK (3-Min) - Negative $TICK divergence into the push up to 885.75. Gap filled by 12:14 PM (central).

Wednesday, April 29, 2009

Wed. 04/29/09 - Bullishness Continues

I'm having some work done at my condo in downtown Chicago and was busy meeting with contractors most of the day (thank God I'm not in the construction business). But from the looks of it, I didn't really miss much.

Market rally on bad or mediocre news is indicative of a bull (or at least bullish) market. Everyone is looking for a retrace; no, wishing and praying for a retrace, and it hasn't materialized yet. I've looked over several time-frame charts (15-min, 60-min, 240-min, and Daily) and they're all bullish. I'm not saying I won't short, but I will be cautious on the short side. This market is not letting up and the more bears that pile in on the short side, the stronger the next leg up will be. At the rate this market is moving, breaking above 900 shouldn't take a lot of effort. We've developed substantial support in the 830 area, and now in the 850 area. A pullback to 850 is within reason. My only concern at this point is the weakness in NQ.

On this end, I won't be able to trade tomorrow either since I have to be at the condo at 8:30 AM sharp to get the contractor going on the work. Hopefully I can trade the afternoon session. Personal Income and Outlays at 7:30 AM (central), Jobless Claims at 7:30 AM (central), Chicago PMI at 8:45 AM (central) tomorrow.

I'll leave you with the Daily chart of the S&P Cash Index and the ES. Let me know your thoughts and/or market outlook for the coming days/weeks.

ES - Daily


$SPX.X - Daily


ES/$TICK (3-Min) - Negative $TICK divergence on the push up 879.25. Open gap at 851.25.

Tuesday, April 28, 2009

Tuesday 04/28/09 - Indecisive price action

I won't bore you with the excuses (although I have a few), bottom line is, I didn't adjust to the market's pace (or lack of), and got chopped. There just wasn't any follow through on the moves today; my trades would go 1-2 points in favor, but my targets were usually 3-4 points and I would try to be patient and hold out for target, and instead get hit with a loss since price would reverse hard! I had 25 trades today (32% win rate) with 3 Longs (all losers), and 22 shorts (36% win rate) and ended the day with a net loss of -$310 ($157.20 lost on the 3 Longs, and $152.80 lost on 22 shorts). At least I kept it tight. I made several mistakes. First mistake was trading while I was mentally frustrated and physically occupied with non-market related issues, and not "in the zone". Second, I got sucked into trading the afternoon range-bound chop, and reversed my position several times which resulted in several small losses. I should have just waited it out, but I really thought the market was going to drop to at least the 851 area, and wanted to be positioned short into the drop. After I was down over $300, I decided to call it quits, and of course we got the break-down in ES right after I quit for the day (so frustrating!). And that brings me to an important question: Should I impose a loss-limit while I'm on the Sim? I would definitely have a loss limit on the real $ account, and it makes sense to treat the Sim trading as close to real $ trading as I possibly can. But on the other hand, I miss out on additional screen/trade time if I quit early in the day. Post your thoughts in the comments.

An update on my friend; he netted +$55 or so today after commission. Not bad at all considering the price action.

GDP at 7:30 AM (central) and FOMC Meeting Announcement at 1:15 PM (central) tomorrow.

ES 233-Tick Bar Chart (Morning Trades)


ES 233-Tick Bar Chart (Afternoon Trades)


ES/$TICK (3-Min) - TICK MAs were hovering around the zero-line most of the day; indicative of the indecisive market action today. We got the gap-fill at 9:42 AM (central)

Monday, April 27, 2009

Monday 04/27/09 - One for the bears

I used the Infinity AT platform for my trades today so I won't be posting the usual TradeStation trade execution chart. I manually marked some of the morning trades, and will post that chart below. The net gain on the day was +$300, mostly due to a Long entry at 858 off a pullback, which netted +5 points. I was trading 1 to 2 contracts today; although majority of the trades were with a 1-lot. The net gain would have been higher but I tried trading the open, and lost some money during that time period. I was long at 851.50 right off the open, but was too quick to move my stop-loss to break-even! I'm not used to trading the open and need to adjust my risk management to handle the volatility during the opening range. Of course I always have the option to just sit out during that time, but some of the best entries over the past few days have been very close to the open. Plus, I was expecting gap-fill, so wanted to enter Long at the best available price. I also had limited screen time since I was on the phone with recruiters, etc. Here's a 610 tick bar chart showing a few of the morning trades; there were a couple of losers during the opening range which aren't marked on the chart.


My friend who's learning how to trade the ES, ended the day with a net gain of +$350, and his trades were all based on the simple price action method I taught him last week. I'll keep you guys posted on his progress over the coming days/weeks.

Redbook out at 7:55 AM (central) and Consumer Confidence at 9:00 AM (central) tomorrow morning. I'll probably sit out the first hour. Trend is down at the moment; lets see if tomorrow's data can shake things up :-)


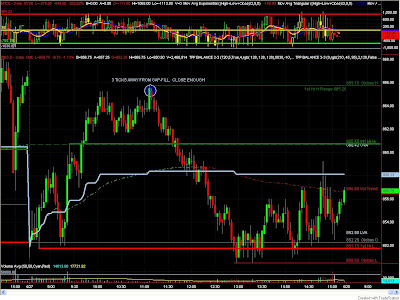
ES/$TICK (3-Min) - Came within 3 ticks of gap-fill; close enough to be considered filled.

Sunday, April 26, 2009

Friday 04/24/09 - Be aware of Market Moving News

Started a bit late on Friday morning due to the economic data being released in the morning. It's safer to let the market digest the data, and then enter trades based on some fresh support/resistance levels. I essentially had two trading ideas/sequences on Friday. The first trade was entering Long at the 857 area with an expected initial target of 860.75. That worked out OK for me and then I sat on my hands for the next move. The next area in-play was 860-865.25. My plan was to short a break of 860 (I had a sell stop order in at 859.75) or to buy a break-out of 865.25 with a 3-4 point target in either scenario. I was aware that some "stress-test" related news was going to be out at 1:00 PM (central), and based on price action (trend was up), I was long at 861 with a reversal-stop at 859.75. Seemed like a safe play at the time. Once the news came out, I got stopped out of my Long position, and entered into a Short position, but the move came in so fats & furious, that my short position got stopped out for a 2 point loss on that swing up. I entered long again expecting the up-side to continue since we were in an up-trend prior to the news. But, I got stopped out yet again, so I again, entered short around 860 and exited around 855 (853 was a support level). I ended my trading day there at 1:15 PM (central) with a net gain of +$425.10 with a win rate of 38.4% and an average profit factor of 1.64 (the profit factor on my short trades was 8.85!). I could have certainly handled the situation better by NOT entering Long simply because price reversed after that break of 860. That would have saved me a few hundred in losses. The better play would have been to remain flat into the news, and then enter short on break of 860 with a tight stop or enter long on a break-out of 865.25. Lesson learned! Here's a snapshot of my 610 Tick bar chart from Friday. It should give you an idea of what I look for, and how I read price action:


Looking at this past week's results in TradeStation, my net gain on the week was +$897.40 with a win rate of 39% and an average profit factor of 1.53. This number doesn't include the gains from Tuesday, when I was experiencing technical problems with TradeStation (caused unnecessary losses), and used the Infinity AT trading platform. If I count those trades, the weekly gain would probably be around +$1,600.

Going forward, I'll be looking at 868.75, 872, 878 and 883 as possible areas of resistance. I'll be looking at 860, 850, 848.75 (OPEN GAP) and 833 as areas of support. Hoping for continued upside action!

On to the regular charts...

ES/$TICK (3-Min) - Open Gap at 848.75 Below


ES 15-Minute - Price above 34 and 200 EMA. 850 level held support.

Thursday, April 23, 2009

See One, Do One, Teach One

"See One, Do One, Teach One" - I first came across this phrase in Dr.Brett Steenbarger's book, and upon doing a quick Google search, here's a definition I found for this phrase: "A traditional format for acquiring medical skills, based on a 3-step process: visualize, perform, regurgitate". If this form of learning can be applied to something as critical and difficult as medicine, then why not apply it to trading? I bring this up because one of my friends recently asked if I could teach him how to trade, so I spent an afternoon with him going over the price action charts I post on my Blog, and then handed him a copy of Reminiscences of a Stock Operator, which he has almost finished reading. Today he came over to watch/trade the market in real-time at my place, and he performed really well! He was able to net +$112.50 in 2 hours trading the ES. Now keep in mind, today was the first time he ever saw a chart of the ES in real-time, and he got these results armed just with Reminiscences of a Stock Operator and the basics I covered with him in one afternoon (support/resistance, trend, reading price action and identifying higher-highs/higher-lows/lower-highs/lower-lows, and the definition of a candle-stick). That's IT! Going over the charts with him in real-time further enforced the trading principles in my own mind. Dr.Brett recommends saying your thoughts aloud because listening to yourself forces the mind to re-analyze the idea, and some ideas "sound" incredibly stupid once you say them aloud. Now he also placed some bad trades, which I recommended him to stay out of, but he wanted to get into them anyway, so for the sake of education (learning from mistakes), I entered him into the trades on Sim, and we promptly lost -$225.00. If we discount the two bad trades, the net profit on the day would be +$337.50.

My point is, teaching someone else how to trade will probably make you a better trader (+1 for karma, I suppose). So lets share knowledge and become better traders.

Durable Goods Orders out at 7:30 AM (central) and New Home Sales data out at 9:00 AM (central) tomorrow morning. Aside from that, the 830 level held today so that's a good sign for the bulls. I'm hoping for continued movement to the up-side.

ES 610-Tick bar Chart (Trades)


ES/$TICK (3-Min) - Gap filled by 9:03 AM (Central)


ES 15-Minute - Price above 34 and 200 EMA. 830 level held.

Wednesday, April 22, 2009

Wed. 04/22/09 - Sorta getting a hang of this

Trading with price action is proving to be a life saver here. Much less stress and doesn't require you to be glued to every tick. I wasn't expecting much today since my alarm didn't go off, and I missed watching the open. I got to the screens around 9:25 AM (central), noticed that I missed the entire up-move, which kinda sucked since I was anticipating an up-move. I stuck with using TradeStation for order execution today since it's very convenient to see the trades automatically plotted on the charts; makes for good post-market analysis. Today's trades were mainly quick scalps since my internet was down for about 45 minutes (Comcast came over to check some connectivity issues I've been experiencing). I also closed down pretty early today since I had scheduled a lunch. Despite all that (or maybe Because of all that), I ended the day with a net gain of +$516.40, with a 8.46 profit factor and a win rate of 43%. The win rate TradeStation produces is a bit misleading since it classifies a break-even/scratch trade as a Loss. Going over the trade list, I see a total of 14 trades, with 1 loss (-1 pt) and 7 break-even/scratch trades. I'm keeping my risk management fairly tight, so the # of scratched trades is pretty high. Other than that, check the marked up trade charts below for details.

Looking for 830 to hold as support. If we get a break of 830, I think we'll break the prior swing low at 823 and head down to 815. I really hope that doesn't happen. Would be nice to see the ES climb to 900+. Watch out for Jobless Claims at 7:30 AM (central) and Existing Home Sales data at 9:00 AM (central). I'll most likely be sitting out the first hour tomorrow morning.

ES 610-Tick bar Chart (Overnight/Market Open Price Action & Trades)


ES 610-Tick bar Chart (Morning/Early Afternoon Price Action & Trades)


ES 610-Tick bar Chart (Late Afternoon Price Action)


ES/$TICK (3-Min) - Gap filled by 9:15 AM (Central)


ES 15-Minute - Price below 34 and 200 EMA

Tuesday, April 21, 2009

Tuesday 04/21/09 - That's more like it

Two gap-and-go days are quite rare, so I was anticipating a gap fill this morning, which we got right from the open, and which is exactly why I didn't trade it. I'm really starting to question whether I should sit out the first 30 minutes, or just be more cautious during that time. The best trades over the last two days were right at the open. I was able to take advantage of the morning pullback taking some stabs on the short side in the 825-830 area; I was too quick to bail on my trades since staying in the trade too long resulted in losses yesterday. Because of being overly cautious and moving my stop-loss to break-even too quickly, I was up only 2 points in the first hour and it took me a few trades/scalps to get there. Terrible! At the very minimum, I should be shooting for +2 points on each trade, ideally the targets should be +3, +5, +8 pts. Things got better for me after the first hour, and I started trading to the Long side, and made a couple of trades for 2-3 points in the 835-840 area. 839-842 was a resistance zone, and I was able to trade it to the short side, by selling at 840 for +2 pts, and then again at 838.25 for a couple of points. I'm glad I was able to trade it on both, the long and short side, as opportunity presented itself, and I was able to keep the trading/risk fairly tight. I don't know the exact amount of my gain today since my execution platform crashed in the afternoon wiping out the trade history, but I can count at least 5 trades where I exited for +2 points, so I know I was up at least 10 pts; probably more like +13-15 pts today.

I experienced some issues with TradeStation this morning, where the charts would freeze or the order execution wouldn't work. I tried exiting one of my trades at break-even but kept getting the "Order Rejected" message, which turned a break-even trade into a 3 point loss. Going forward I'm going to start using the Infinity Futures trading platform in Live Simulation mode. The only drawback is that I won't be able to post a trade chart with the exact entries/exits, which TradeStation plotted automatically for me. I'll try marking up my trades manually but that could become quite a pain. We'll see.

The final point I want to make is, PRICE ACTION trumps all! Being aware of price action (swing highs/lows, higher highs, higher lows, lower highs, lower lows) makes trading a much more relaxed activity since you have TIME to analyze and react to the price action. This is still something I'm working on, and that's why even on days that I don't place any trades, I mark up my charts in order to better understand price action.

For tomorrow, I'm looking for the following levels to hold as support: 840.50, 837, 833. Expecting resistance at 854, 858 and 861.50. My bias is bullish though. On to the charts...

ES 610-Tick bar Chart (Overnight/Market Open Price Action)


ES 610-Tick bar Chart (Morning/Early Afternoon Price Action)


ES 610-Tick bar Chart (Late Afternoon Price Action)


ES/$TICK (3-Min) - TICK above zero-line most of the day. Gap filled by 10:15 AM (Central)


ES 15-Minute - Price above 34 and 200 EMA.

Monday, April 20, 2009

Monday 04/20/09 - Not bad considering

I hate days like today where the big trade is right at the open, with little opportunity to enter later. Judging from other traders' Twitter posts, I wasn't the only one looking for a halfway decent retract to enter short. Unfortunately, the retrace never materialized, and mostly out of frustration, I started taking stabs to the Long side. I had 4 trades total; all Longs, but only one gain (the small scalp at the end). The first trade was entered based on support at 843, which didn't work out. The next two trades actually went 1-3 points in my direction before reversing. I was holding out for a retrace to the 842 area. Usually, I move my stop to break-even pretty quickly, but I didn't want to get shaken out of my trades so stuck with my initial stops, which are fairly tight to begin with (2 pts max). I had to take my continuing education realtor's exam in the afternoon (passed with flying colors), so only traded the morning and ended the day with a net loss of -$172.10.

Going forward, looking for 823-825 area to hold as support. On to the charts...

ES 610-Tick bar Chart (Trades)


Open/Unfilled Gap at 867


ES/$TICK (3-Min) - $TICK below zero-line all day.


ES 15-Minute - Price broke below the 200 EMA

Sunday, April 19, 2009

Friday 04/17/09 - Where do we go from here?

I only traded the first hour or so on Friday netting a little over +$100 but Trade Station isn't showing me the trades for some reason, so the trade chart won't be posted. I later marked up the 610-tick chart in order to stay current with the price action, and the marked up charts will be posted below.

The big question is, where do we go from here? Looking at the daily and weekly charts, there is strong resistance in the 880-884 area. Looking at the 15-min chart, I'm thinking we may get one more push higher into the 880s, and then a strong pullback (3 drives to a top?). If we break above 884, getting to 900 shouldn't require too much additional effort. I don't claim to be a "market technician", so these are amateur observations. My only other concern is, a lot of traders are expecting a pullback here, which is usually a good reason for the market to push higher (traders enter short too early; then cover pushing prices even higher). Check out the following 15-minute chart and let me know what you think:

ES 15-Minute


In support of the bulls, price did break to a new swing high (872) and closed above the mid-point and volume trend indicating strength. The NYSE TICK also remained above zero for most of the day.

On to the regular charts...

ES 610-Tick bar Chart (Morning Price Action) - Range-bound all morning


ES 610-Tick bar Chart (Afternoon Price Action)


Gap filled within 10 minutes of open


ES/$TICK (3-Min) - $TICK MAs above zero most of the day

Friday, April 17, 2009

Thursday 04/16/09 - No trades

Just watched the market Thursday morning, and it behaved as I anticipated, but I knew I was taking off early so didn't place any trades worth mentioning (gain of a few bucks). Instead I decided to enjoy the weather and took the bike out. I'll post the marked up charts though.

ES 610-Tick bar Chart (Morning Price Action)


ES 610-Tick bar Chart (Afternoon Price Action)


ES 610-Tick bar Chart (Late Afternoon Price Action)


Gap filled by 9:00 AM


ES/$TICK (3-Min)


ES 15-Minute

Wednesday, April 15, 2009

Wed. 04/15/09 - Sucked Big Time Today

My head definitely wasn't in the right place today, and that's reflected in today's net loss of -$1297.50; worst single-day loss to date with only 12% of the trades being profitable. So, what happened? Well, a few problems:
1. Had a dentist appt, and jumped the gun on shorting this morning. I was expecting a drop to the 836 area, which happened while I was at my dentist's office. The morning trades resulted in roughly a $400 loss.
2. Ignored price action in the ES, and put too much faith in inter-market analysis. NQ was showing weakness, and a lot of times, NQ can be used as a leading indicator, but not today. Price action trumps ALL indicators, and I should have paid more attention to price action instead of taking trades off weakness in NQ and the energy sector.
3. Traded 2 contracts at times, which helped magnify the loss.
4. Tried making back the loss even though I should have just closed down for the day.
5. Had other distractions throughout the day (calls from recruiters, etc)
6. My bias to the down-side was too strong today. I had 1 Long trade (profitable), and 24 Short trades, and only 2 of those were profitable. Instead of trading from the perspective of "I don't know what's going to happen next"; I was trading with the thought "This thing's DEFINITELY going down!". I'll pay more attention to my thoughts going forward, and will proceed with caution when I'm 100% sure about direction, because you can never really be 100% sure price will go up/down.

And this is why I'm still on Sim. I'd rather learn (re-learn?) these basic lessons without paying up. Going forward, I think I'll put a $750 loss limit in place and just stay out of trades all together if I'm on the phone, or have an appt.

I'm not sure where this market is headed. We've gapped down two days in a row, and the gaps have been filled both times, which is a bullish indication. Price has held the 200 EMA on the 15-min chart, which is also a good sign for bulls, but I feel like this up move is running out of steam, and we may see that open gap at 822.75 get filled. I know I shouldn't really spend too much time predicting where price is going and just trade in the moment.

On to the charts...

ES 610-Tick bar Chart (Morning Trades)


ES 610-Tick bar Chart (Afternoon Trades)


Gap filled by 9:15 AM


ES/$TICK (3-Min)


ES 15-Minute

Tuesday, April 14, 2009

Tuesday 04/14/09 - Back home

I got back to Chicago this past Sunday. Overall, the trip to Geneva and Dubai was a good time but I did get a little bored towards the end of it (Dubai is a small place and there's only so much to see). I met with Dubai Professional Trading Group while I was out there. They're a trading arcade & prop firm and primarily trade futures and commodities. I also finished reading Reminiscences of a Stock Operator during my trip; it is an excellent book and I recommend everyone read it at least twice (I plan on re-reading it myself in the next couple of weeks).

I didn't trade yesterday, and barely put on any trades today. Just didn't feel right today (psychologically), so stayed away from the screens for most of the day. I would just swing by the PC here and there, and put on a trade if I saw something at that moment. Tomorrow will be light as well since I have a dentist appointment. Ended the day with a net gain of +$215.40

I was about to download pictures from my Dubai trip, and since I had my camera handy, I figured I would take a quick shot of my trading setup, so here it is:


On to the charts...

ES 610-Tick bar Chart (Trades)


Gap filled by 9:45 AM - Technically price came within 3 ticks, but it's close enough.


ES/$TICK (3-Min)


ES 15-Minute