My views on trading the E-Mini S&P 500 Futures utilizing Price Action, Market Structure, Volume/Market Profile and the Auction Market Process. Visit www.EMiniPlayer.net for Daily Key Support/Resistance Zones, Trade Plan and Educational Recaps.
Monday, November 30, 2009
Key Levels and Scenarios (S&P 500) for Tuesday 12/01/2009
Scenario and levels played out beautifully today...very structured moves and consolidation at known levels. Today's price action helped solidify the support in the 1082.50-1086 area. We can discern two things from that: 1) We'll probably get a bounce on first touch and 2)If price breaks through support, anticipate a fast move down to the extension targets. Monday's range was also within the top half of Friday's range (bullish). Price is currently at 1095.50 and building value above Monday's VWAP (1091). 1089.50-1091.25 is strong support at this point and I'm anticipating a bounce on first touch. My immediate bias as of this writing (11 PM CST) is bullish.
Redbook data out at 7:55 AM (cst) and ISM Mfg Index, Construction Spending and Pending Home Sales Index out at 9:00 AM (cst). Monday was an inside day. We've consolidated and accepted value here. Anticipating range expansion tomorrow!
Bullish Scenario (above 1089)
My bias will remain bullish as long as price remains above 1089. From here, I'd like price to break through that 1098 level, and test 1101.75. We may get some consolidation in the 1101.75-1103.25 zone, but if we break above 1101, I would anticipate a test of the 1106-1108 (a lot going on there). That would be a great place to scale out of a Long position, or if you're adventurous, even reverse to the short side for a rotation down to 1104-1105. Beyond 1108, the 1110-1112 is solid resistance. If price manages to crack above that level, which is possible, tagging 1115 shouldn't require too much effort.
Bearish Scenario (below 1089)
I will not consider shorts unless price breaks below 1089. That is an important area IMO, and if the market is truly gaining steam, the level should hold. At a minimum, I'm anticipating a bounce on first touch in the 1089.50-1091.25 area. If price bounces and starts heading down again, entering short with a tight stop would be a good risk/reward setup. If we break 1089, we could go down to 1082.50 in a hurry, and to 1079.25 below that. Again, the safer play would be to short the bounces from that point on. We have strong support in the 1076-1078 area so scaling out ahead of that would be prudent.
ES - Daily Bar Chart with Volume Profile and Key Levels
Sunday, November 29, 2009
Key Levels and Scenarios (S&P 500) for Monday 11/30/2009
Despite the big moves on Thursday/Friday last week, the key levels haven't really changed much. 1198 is immediate resistance, with the overhead initial resistance level at 1101.75. Initial support is 1089.25. ES is currently building value under 1097. Last year, the Monday following Black Friday was a straight down trend from the globex overnight session into the day session close. My current bias is to the short side, but I'm not anticipating range extension on the down side. Higher probability of range extension to the upside, since we're already in the upper quadrant of Friday's range.
Bullish Scenario
The initial support zone is 1086.75-1089.25, and I'd like to see that area hold before I consider trades on the Long side. 1082.50 is also still a pretty important area. Ideally, price breaks above 1097, hits the 1101-1102 area, rotates down, and holds 1097-1098 on the retrace. At that point, entering Long with a stop at/below 1098 would be a high-probability trade, IMO. Scale out at 1102, or move stop to break-even and let it test the next area at 1105-1107.50. Scaling out or reversing position to the short side at 1107.50-1108.50 area is looking good as well. Above 1108, the obvious resistance is 1112.25, and then I'll look towards the range extension targets to provide areas to scale out or enter short.
Bearish Scenario
I think the bearish scenario is in-play at the moment. 1197-1198 is holding as resistance. Above that, if 1102 holds as resistance, and we come back down and break below 1098, shorting pops would be the name of the game for me. Who knows, we may not even get to 1102. I would scale out of shorts at the support zones/levels identified on the Key Levels chart.
ES - Daily Bar Chart with Volume Profile and Key Levels
Thursday, November 26, 2009
Key Levels (S&P 500) for Friday 11/27/2009
In case you guys were busy with the Thanksgiving festivities and missed the news, Dubai requested a debt 'standstill' till May; essentially saying they can't make payments on their debt until May, 2010 (full story on Yahoo Finance). It's a small loan - roughly $60 billion! That, in turn, shook up the world markets and the S&P futures took a nose dive down to 1082.75 (1082.50 is a Key level). So, now the question is: will 1082.50 hold? The Dubai issue has been on the radar for a while now, so I don't know whether it's really a sufficient catalyst for a big sell off, and not to mention, $60Billion is not really a catastrophe. But anything can happen so best to stick to the charts and levels.
Bullish Scenario (if 1082.50 Holds)
If 1082.50 holds, I'm thinking a move back up to 1097 is do-able, but I'm not anticipating it to be in one quick shot; although even that scenario is certainly possible if shorts decide to cover all at once at the open (unlikely). I'm anticipating price to make a rotational move up, making pit stops at the resistance levels along the way (refer to chart for levels). Initial area of resistance is 1087.50-1088.50, above that we have 1093.75-1097 (kinda wide, but that's how I'm reading it right now). 1100-1101.50 above that. Longs are counter-trend for now, so buy the dips, sell the rips!
Bearish Scenario (if 1082.50 breaks)
Below this area, we have initial support at 1078.50, and stronger support at 1076. Anticipating that area to hold on first touch; good area to scale out of short and reload on rotation. 1072-1075 are the range extension targets, and would be the second area to scale out of shorts, or even initiate a Long position. 1069.50 after that, and 1064 is the Final target if we get a big sell off.
Good luck tomorrow!
ES - Daily Bar Chart with Volume Profile and Key Levels
Wednesday, November 25, 2009
Wednesday 11/25/2009 - Market Review
1) You will have better control over your anxiety/psychology since you're waiting for price to get to the area you want, and you'll be prepared to enter the trade at that level
2) You'll avoid the chop in the middle
3) You'll be able to use a tight stop-loss since the difference between the level where you enter a trade, and the level where you're proven wrong will usually be within 2-3 points, if not less.
Following is today's 5-minute day-session chart. Look at the 5-min chart in conjunction with the Key Levels and Scenarios post from last night. This is simple stuff, just requires some patience and discipline. Happy Thanksgiving!
ES 5-Minute Day Session Chart for 11/25/09
Tuesday, November 24, 2009
Key Levels (S&P 500) for Wednesday 11/25/2009
Scenarios posted last night worked out great today! I mentioned last night that "1098 could provide a bounce, as well as 1094-1095." - and we got a solid bounce at 1095 into the VPOC cluster, with price peaking at 1106.75. ES is currently trading at 1105.50, building value above 1100. Going into tomorrow, my bias is still bullish. From a seasonality perspective, we saw a huge up move on the day before Thanksgiving last year, but 2008 was a crazy year! At this point, I'm bullish above 1100, neutral above 1089 and bearish below 1089. This doesn't mean I won't initiate shorts if we move into the range extension areas (1115-1119), but above 1094, I'd rather buy the pullbacks. Below 1089, I'd like to sell the bounces. Today was an inside day, and the bullish/bearish scenarios haven't really changed since yesterday.
Lot of Econ #s coming out between 7:30 am and 9:00 am (cst). Durable Goods Orders, Personal Income and Outlays and Jobless Claims out at 7:30 am (cst). Consumer Sentiment at 8:55 am (cst). New Home Sales data out at 9:00 am (cst). Be prepared and keep an open mind; even though it's a day before a holiday, we could see some big moves tomorrow!
ES - Daily Bar Chart with Volume Profile and Key Levels
Monday, November 23, 2009
Key Levels (S&P 500) for Tuesday 11/24/2009
Monday rally pattern continues, and now 8 of the last 9 Monday's have been bullish! The bullish scenario put together last night worked out well; price made a solid up move over night once it broke above 1095.25. 1102 area acted as resistance over-night, and price rotated back down to 1099.50 and chopped around in that area till 8:10 am (cst). At the moment, the ES is trading at 1101.25 and the immediate price action is pointing towards lower levels. But we had a nice up move today, and price could just chop around and consolidate within Monday's range. High probability of range bound trade tomorrow so be nimble and mindful of your directional bias! GDP data out at 7:30 am (cst), S&P Case-Shiller HPI out at 8:00 am (cst) and Consumer Confidence data out at 9:00 am (cst). If you're new to the S&P futures, I would just sit out the first hour.
Bullish Scenario
We have a cluster of VPOCs from 1105-1106, and price needs to break through that to get some breathing room to the upside. After that, I would anticipate a test of the highs at 1112.25. Price has been knocking around that area for a few days now, and bears are getting too comfortable initiating shorts in that area, so a break-out through that area would not surprise me. Beyond 1112.25, 1116 is do-able with 1117.75-1120 being the range extension target zone. We also have some nice areas of support below. 1099 is near-term support in the Globex session. Below that, 1098 is previous week's mid-point. 1097.50 is the 50% retracement of the current swing on the Hourly chart. 1094 is the initial support level for tomorrow's session. There's a nice cushion of support below us, and I'm not anticipating price just slicing through all that in a single attempt. 1098 could provide a bounce, as well as 1094-1095. Bias shifts to bearish below 1090.25 (open gap).
Bearish Scenario
As you can tell, my current bias is to the Long side, but I must have a bearish scenario in mind since the market can do anything at any time! We have initial resistance in the 1105-1106 area (VPOC cluster), and that could be a good area to take a stab on the short side if momentum is weak. On the downside, if price manages to slip back through 1089, I would shift to shorting the bounces. Downside targets and areas of support are annotated on the Volume Profile chart.
ES - Daily Bar Chart with Volume Profile and Key Levels
Sunday, November 22, 2009
Key Levels (S&P 500) for Monday 11/23/2009
As @Jediphone pointed out on StockTwits, 7 of the last 8 Monday's have been bullish with an average gain of 1.28% (source: Phil's Stock World). In doing my own research, I found that the Monday after OpEx Friday was bullish in October, and the Monday of Thanksgiving week in 2008 was bullish as well. It's something to keep in mind, but of course, trades should be initiated based off what the market tells you in real-time. Existing Home Sales data out at 9:00 am (cst) tomorrow morning.
Bullish Scenario
1089 (VPOC from Friday) is near-term support. On the up side, we have near-term resistance at 1095.25. I'm bullish above 1095.25. After that, we have range extension targets in the 1098.25-1099.25 area, which could act as short-term resistance. If price gets to that area, I would anticipate a test of 1100, but that's a good area to scale out of Longs, and re-load at better prices. Above 1100, 1102.50 is a level that could offer stronger resistance and provide a rotation back to the 1099-1100 area. Above 1102.50, 1106 is strong resistance, and we have an Open Gap at 1108.50. We're currently building value in the 1094 area.
Bearish Scenario
1089 is the Volume Point of Control from Friday, and price would need to get below that level for sellers to begin taking control. 1085.25 is the next level of support, and the line in the sand for me between bullish/bearish bias. Below 1085.25, my bias shifts to bearish and shorting bounces becomes the higher probability play, IMHO. If we get below 1085.25, we'll likely test 1082.50, and quite possibly even break below it to get to that 1076-1079 area. I would expect the sell off to really accelerate if we break below 1076. 1064 has been the final bearish target for several days now.
ES - Daily Bar Chart with Volume Profile and Key Levels
Saturday, November 21, 2009
OpEx Friday - 11/20/2009 Review
Options Expiration Friday
I checked out the chart from October's OpEx Friday (10/16/09), and see a lot of similarities between 10/16 and 11/20. I wasn't concerned with the absolute values/prices on each day; just the directional swings. Lets do a little compare & contrast between 10/16 and 11/20 and look at the similarities:
- Price sold off in the overnight session on Both days.
- Price retraced back up into the cash Open
- Price stalled and reversed within the first 30 minutes of the open. Price began reversing down at 8:45 am on 11/20, and at 8:55 am on 10/16. The exact times aren't really important, but it's an interesting coincidence.
- Price retraced back down on both days. Price broke below the Globex Low on 10/16, but wasn't able to get to the Globex Low on 11/20.
- Price then chopped around, and moved higher into the previous day's POC on 10/16 and 11/20.
- Price moved back down into the close, and the down swing began at almost the same times on both days.
ES - 5-Min Chart (November 20, 2009)
ES - 5-Min Chart (October 16, 2009)
Thursday, November 19, 2009
Key Levels (S&P 500) for Friday 11/20/2009
The bearish scenario put together yesterday worked out great this morning. I was anticipating the move below 1100 to be fast - and price dropped 13 points from 1100.75 to 1087.75 in the first half hour of market open (1088 level marked as strong support for a few days now). The 1088 support level held (a 1.50 pt poke below 1088 doesn't really invalidate that "area" IMO), and I'm still counting on that area to hold as support. Could price break below it and test 1082.50? Sure. But I would anticipate a bounce around 1087 on first touch tomorrow (if we get there). Buyers were very active between 1090 and 1091.50 today. The VPOC for today was around 1092.75, and price is currently building/accepting value above 1091. Lets also keep the big picture in mind (daily chart). From that perspective, today's down move is no big deal, and I would anticipate the bulls to actively defend the Key areas of support (1088, 1082.50, 1076).
ES - Hourly Chart (Downside break-out from Triangle)
Bullish Scenario
On the upside, we now have resistance in the 1197 area (anticipating that to hold on first touch), then minor resistanct at 1100, followed by stronger resistance around 1102.50. We also have an open gap at 1108.50 now, and I would anticipate a gap fill on a move above 1102.50.
Bearish Scenario
On the bearish side, I'm anticipating 1087 area to hold on first touch. Below that, we could test 1082.50. It's interesting that price closed at 1082.25 on last month's options expiration Friday. Anticipating 1082.50 to hold on first touch, at which point, shorting the bounce would be a safe play for re-test/potential break of 1082.50. Below 1082.50, we could get a quick move to 1079; and then a grind down to 1076.50 area. Anticipating 1076 area to hold as support on first touch (scale out of shorts, or reverse to Long for a scalp, or possibly more here). If the selloff is really nasty, we could even get to the ultimate downside target of 1064 (not anticipating a strong selloff).
ES - Daily Bar Chart with Fib Levels (Perspective!)
ES - Daily Bar Chart with Volume Profile and Key Levels
Crude
Don't have time to do the levels for Crude tonight.
Wednesday, November 18, 2009
Key Levels (S&P 500 and Crude) for Thursday 11/19/2009
After yesterday's inside day, I was anticipating some range expansion today but all we saw was range-bound price movement. Maybe this is due to options expiration week? Who knows (who cares)? The levels were defined and price just bounced around within those areas. Today worked out great for scalpers, but if you were holding on to trades too long, anticipating range expansion, you probably scratched a lot of trades. In any case, price closed at 1108.50 (known level), with the VPOC/VWAP around 1105.75. Yesterday's VPOC was right around 1105 as well so keep an eye on that area. So far tonight, price hit a high of 1109.50 in the Globex session, and then pulled back to 1104 (1103.25 is previous week's high, and 1100 is near-term support). If you look at the 60-minute chart, you'll notice price is consolidating in a triangle, and it will break out of this formation sooner or later. On the upside, I'm eyeing the 1122 level and feel that price could test that level very soon. We've had two tight range days, so be open to larger moves in the coming day or two. Jobless Claims data out at 7:30 am (cst) in the morning.
Bullish Scenario
If we get a break-out to the upside, I would not Short against it until the momentum died down or we approached a big resistance area like 1120-1122. When price broke out above 1103.25 on 11/16, it ended up making its way all the way up to 1112.25 (9 pts higher). So, if we get a break out above 1112.25, could we again move up 9 points, to 1121.25 (oh so close to that 1122 level)? You bet! "Anything can happen at any time" - keeping that phrase in mind will allow you to be open to any and all possibilities instead of having the mindset where you Know what will price Will do. No one Knows!
Bearish Scenario
Looking at the Volume Profile chart, we can see that price has been building value higher over the past few days. We've established nice cushions of support from 1088 to 1100. But because we've established all this support, if/when price breaks down and we get a sell-off, the move could be fast & furious. A lot of Bulls will be put into Losing positions below 1088, and I see that as being the Key support level for the time being. Below that, we could go to 1076 fairly quickly, and finally 1064. I will rely on the 1100 support level until it's broken. Bullish above 1100, bearish below 1088.
ES - Hourly Chart with Price in a Triangle
ES - Daily Bar Chart with Volume Profile and Key Levels
Crude
The Crude (Dec contract) moved within the support and resistance zones defined in yesterday's CL Volume Profile chart. The 138.2% extension was at $80.34, and the high of day on Crude was $80.33 today. Crude also broke out of the bearish channel today. I'm anticipating near-term support in the $79 area, and strong support in the $78 area. Bullish above $79 and Bearish below $77.80.
Tuesday, November 17, 2009
Key Levels (S&P 500 and Crude) for Wednesday 11/18/2009
ES broke out above 1103.25 yesterday so consolidation at these levels was anticipated today (11/17) - No surprises! The 1,100 level gained some strength as support today, but I'm still skeptical on it until price moves above 1112.25. Seeing confluence of support in the 1096.50-1098.75 area now though, and expecting that area to hold on first touch (good place to scale out of shorts and/or enter a low risk Long trade if price gets there). Near-term support at 1105, then 1100. Seeing a confluence of resistance in the 1111.50-1112.50 area and anticipating price to pause there on first touch (good place to scale out of Longs and/or enter a low risk short). Beyond that, we have 1114.50 and then 1118. 1122 is the 50% retracement of the entire down move from 1590s, so a lot of people will be watching that level.
Consumer Price Index and Housing Starts data out at 7:30 am (cst) in the morning. Anticipating range expansion tomorrow.
ES - 5 Min Chart from Tuesday 11/17/09
ES - Daily Bar Chart with Volume Profile and Key Levels
Crude
CL - Daily Bar Chart with Volume Profile and Key Levels
Monday, November 16, 2009
Key Levels (S&P 500 and Crude) for Tuesday 11/17/2009
The scenario put together last night for Monday worked out beautifully in the ES today - No surprises. Going into tomorrow, traders may be looking for the 1103.25 level (last week's high) to hold, but I personally think that area hasn't solidified as strong Support just yet. What have we done at 1103.25? We hit it last week and pulled back to the 1082.50 level (20.75 pt pullback). We broke out above 1103.25 today. That's about all that 1103.25 has going for it. If price pulls back below it, moves back up, and goes on to make new highs, then I would say 1103.25 is solid. Until then, I wouldn't lean on it. 1096-1098 is the area I'll be watching for real support. I think price has danced around that area enough and I'm anticipating that area to hold. One important thing to keep in mind is, as traders, we're NOT in the Prediction business. I don't predict what will happen tomorrow. Hell, I don't know what will happen in the next 30 minutes. I just lay out a scenario (hypothesis), and if the market validates the hypothesis, I take action based on my trading plan. If the market chooses to ignore my hypothesis and do the complete opposite -- well, there's information to be gained from that as well. For example, if I'm anticipating 1096 to hold as support tomorrow, and price breaks below it on heavy selling, that is an indication of strong sellers and initiating a short on a pullback is a decent play at that point. Always be open to both directions. Having conviction in your market reads is one thing but saying "the market WILL do this" or "the market WILL do that" is plain wrong. The market doesn't have to do anything.
Side note: I have final exams next week and am really busy with school this week so I may take a break from posting levels on the Blog and Twitter.
ES - Daily Bar Chart with Volume Profile and Key Levels
ES - Weekly Bar Chart: We're coming up to the 50% retracement of the entire down move from 1590.25 so be extra careful if price reaches the 1122 level.
Crude
CL - Daily Bar Chart with Volume Profile and Key Levels
Sunday, November 15, 2009
Key Levels (S&P 500 and Crude) for Monday 11/16/2009
ES is currently trading above Friday's Value Area and Point of Control, which is bad news for bears. If we open above 1096 tomorrow morning, I would expect a test of the 11/11 highs at 1103.25. There are a lot of stops above that area, so I would not be looking to initiate a short around the 1103-1104 level. Letting the stops get blown out before shorting seems prudent. 1108-1109 looks like a nice spot to take a stab at shorts (if price gets above 1103.25). On the downside, 1088 is Key, IMHO. As long as 1088 holds, bulls are in OK shape. A break below 1088, and price could test 1082.50. If price gets to 1082.50, I would anticipate a stop-run at that level, and price could break through that and slip to 1079. 1076 is Strong Support and I would anticipate that level holding on first touch (good place to enter Long). All the levels mentioned here are probably fine for scalps, but if the goal is a few handles/points, then being patient and entering trades around key levels is critical. Retail Sales data is out at 7:30 am (central) tomorrow morning. Lets see how this scenario works out. As always, trade what you see!
ES - Daily Bar Chart with Volume Profile and Key Levels
Crude
Remember that chart I posted the other day showing the bearish channel on the Crude (CL) Hourly? Crude bounced off the lower end of the channel on Friday. The key levels on Crude have been working out very nicely. Looking at the Volume Profile on Crude, we can see that there isn't a lot of interest (volume) below the $76.35 area ($76.50 was marked as support). Crude opened at $76.58 today on Globex, and similar to the S&P, is currently trading above Friday's Value Area and Point of Control. It's building value above the $76.90 level, so go ahead and pencil that in as support. Break of $76.90 and we could test that $76.35-76.50 area in a hurry. On the upside, expecting minor resistance in the $77.60s. The heavier resistance is in the $78-78.25 area. I realize that's a wide $0.25 range, but based on my brief experience with Crude, it moves in big swings, and often overshoots so it's difficult to pick a specific level. Picking levels is easier in a liquid market like the ES.
Thursday, November 12, 2009
Credit Where Credit Is Due: Thank You!
Key Levels for Friday 11/13/2009
Thursday - 11/12/2009 Setups
ES - 5-minute Chart
Lets walk through the day step by step and rationalize it a bit using basic concepts and S/R levels:
- Yesterday's Low was 1091.25 (support). Price bounced off 1091.75 on the open.
- Yesterday's High was 1103.25 (resistance). Price hit a high of 1101.00 this morning and sold off from there.
- ES moved down from 1101.00 through the mid-point and VWAP and bounced at 1094.25 (sign that bears may be in control now)
- Price retraced back up and chopped around the mid-point and VWAP for a bit (bulls losing the battle), and then popped up to 1099 (1098.50 was .618 retracement of the 1101-1094.25 swing).
- Sold off again from there, and broke down through the mid-point and VWAP (bears in control), and found some support at 1090 (1088-1090 was a support level posted on earlier Key Level charts).
- At this point, the first hour low has been established at 1091.75 and will act as an area of resistance.
- ES sells off again, and finds some support at 1088.50 (1088 posted as Key Level on earlier charts).
- Price attempts to retrace back up a couple of times, but doesn't manage to cross 1091.75 on a closing basis, and we see more selling pressure.
- We get another bounce at 1087, and price retraces back to 1091 (1090.50 is .618 retracement of the 1092.50-1087.00 price swing).
- The next area of support on the Key Levels chart was 1084.25, and we got a bounce at 1084.50.
- Prior support becomes resistance, so we can now use the 1088s and the 1087s as resistance. Price retraced back to 1087, and sold off again; this time moving down to 1082.50.
- Finally, ES retraced from 1082.50 back up to 1087.50, which is where it closed (1086.50 = Value Area Low).
I hope the commentary was helpful and gave you some ideas on the levels/areas to watch during the day.
Wednesday, November 11, 2009
Wed. 11/11/09 - Levels
ES - Daily Volume Profile with Levels
Tuesday, November 10, 2009
Tuesday 11/10/09 - Levels
Saturday, November 7, 2009
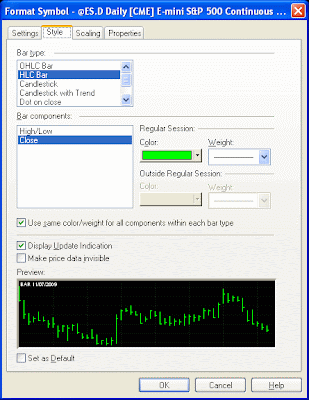
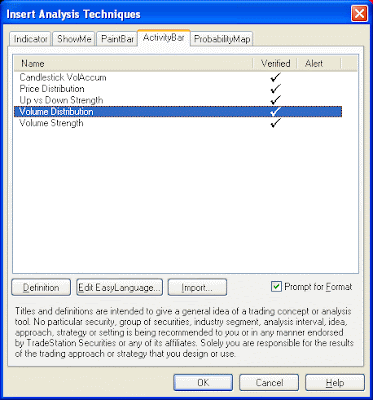
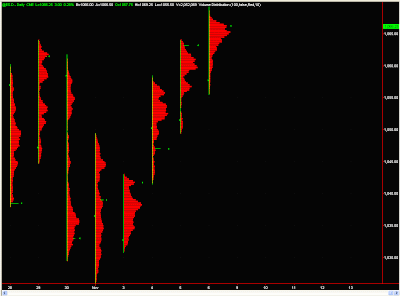
How to Setup a Volume Profile Chart in TradeStation
- Open a new chart and set the symbol to @ES.D.
- Under the Settings tab, set the Interval (time-frame) to Daily.
- Under the Style tab, set the Bar type to HLC Bar or OHLC Bar.
- Now, from the top menu, click on Insert, and then click on Activity Bar
- Select "Volume Distribution" and make sure the "Prompt for Format" check box is checked
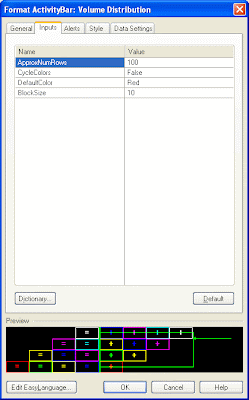
- Under the Inputs tab: set the ApproxNumRows to 100, set CycleColors to False. set the DefaultColor to Red (or whatever color suits you) and set BlockSize to 10
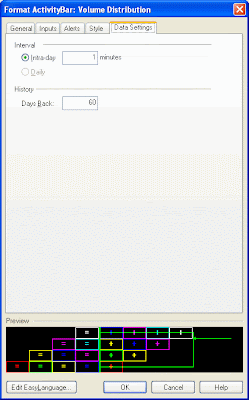
- Finally, under the Data Settings tab, set the Interval to 1 minutes and Days Back to 60 (or however far back you want to go).
That's it! You should now see the following chart:
Hope this helps. Happy charting!
Friday, November 6, 2009
Preparation and Planning for the Next Trading Day
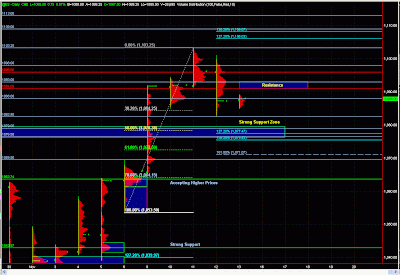
Currently, my homework consists of analyzing the trading day on the 5-minute time frame, and then moving up to the hourly time frame to identify strong support/resistance levels. I use simple Fib extensions and Fib retracements to identify short-term support/resistance. The exercise is not mechanical and is based on price action. Recently, I've begun studying Market Profile, and am integrating volume profile analysis as well. The goal of the nightly planning/prep work is to identify Key Levels in the market, and build out scenarios along with a plan on how I would respond to the scenarios. Price can either move up, down or sideways so the plan doesn't need to be very elaborate but it should provide areas where I want to conduct business (trades). Placing trades at/around Key Levels is extremely important and allows for tight risk management.
I've been posting charts on Twitter and StockTwits for a while now, but I may start posting the charts to the Blog as well. This nightly preparation process is a work in-progress and will be evolving over the coming weeks/months. I'm also looking into integrating simple statistical analysis on historical open/high/low/close price data (details to come later).
Following is the chart I prepared and posted to Chart.ly on Thursday 11/5/09 for Friday 11/6/09:
ES - Daily Bar Chart with Volume Distribution
The price action today remained within the short-term support/resistance levels identified on the chart (1052.25 and 1069) .
What do you do as part of your preparation for the trading day? Do you know where you will be conducting business? As always, comments are appreciated.
"Luck is what happens when preparation meets opportunity." - Seneca
Sunday, November 1, 2009
Ask EP: How did you learn to trade?
Thanks a lot man
Daniel From Spain
---------------------------------------------------------------
Hey Daniel,
I'm busy with work and school these days so don't really have much to post to the Blog. I post charts on Twitter, so if you're interested in how I'm viewing the market these days, follow me on Twitter. I still follow the markets actively and post my analysis on Twitter.
Now on to your main question; I discovered trading and the markets in early 2003, and based on a recommendation from a friend of mine, I began by purchasing a software program that essentially gave buy/sell signals. I funded a stock trading account with Ameritrade and began trading in 500-1000 share lots. It was the absolute worst way to get into the markets. I was basing my trades off a "system" that I didn't understand. I won't mention the software program because it's just embarrassing to admit that I spent thousands of dollars on this piece of junk. On the bright side, after a few months and small losses, I realized the program was junk and tossed it in the garbage.
I then started reading up on Technical Analysis and candlestick charts, and switched to using TCNet for charting. I also found a chat-room that taught stock trading using technical analysis. In hindsight, I didn't really benefit much from the chat room and it turned out to be a hindrance since they used technical indicators, which always looked amazing in hindsight, but didn't work so well in real-time. That's true for most chat room gurus; they look like rock stars after the fact, but don't provide any edge in real-time trading.
I discovered futures towards the end of summer, 2003, and that's when I ditched stock trading and the chat room. I funded an account with Interactive Brokers, ordered eSignal for charting and began trading the YM, ES, NQ, Dax, and Eurostoxx50. Since I was working full-time, I would wake up in the middle of the night to trade the Europe open (Eurostoxx50/Dax), then go back to bed; wake up again in a couple of hours and get ready for work, and trade the U.S. open (ES/YM/NQ) for an hour and then head into work. My office was 5 minutes from my home, so on some days I would come home for lunch and try to scalp over lunch as well. I went through thousands of Live/Real$ trades (I think Simulators weren't as good back in 03'-04'). It was pure trial and error. I started a trading journal on Elite Trader (link to trading journal if you'd like to see the train wreck). I also read books on technical analysis and trading psychology. By February, 2004 I had completely burned myself out and decided to close my trading accounts.
I then got back into trading in the summer of 2008. This time around, I began by reading books on technical analysis, and spending hundreds of hours analyzing charts in Trade Station. I also read a lot of information on the various forums and Blogs. Thanks to Blogging, there is so much more information available for free online regarding trading now as compared to 2003-2004. I also joined the Trade Pilot Pro trading education chat room. I took the ideas they provided and then modified them to suit my personality and style of trading. Joining the Trade Pilot Pro room with was definitely helpful but my focus was trading education. I would ask a lot of questions in the room, and even try to get some one-on-one time with the head traders/mentors after market-close to really understand the concepts. Joe Baker uses a few indicators, but is also very good at reading pure price action. David Dube used to trade for a large financial institution and is also an excellent trader and mentor. Both of them spent a considerable amount of time helping me get up to speed. On top of this, I spent a lot of time analyzing the charts in the evenings on my own, and still do that. It's a great exercise to enhance your pattern recognition skills. I spent a few months in the chat room and then left the room to educate myself. It's important that you not get tied into a trading room. Taking time away and personalizing and internalizing what you've learned is important. This time around I also switched on/off between using my live/real$ account and the Simulator. I think the Simulators these days provide a very realistic field to practice your trading skills. You don't need to risk real capital until you're ready, and I strongly encourage newer traders to fully utilize the Simulator. Just make sure you use the Simulator properly. Focus on POINTS; not the dollar amount since it doesn't matter if you make 2 pts on a 1-lot or a 100-lot on Sim, so forget the dollar amounts and focus on how many points per contract you can capture during the day. Utilize realistic stops/targets on Sim. Take every setup that meets your trading plan and don't be afraid to lose on the Sim. Losses are actually great since you learn more from them, so while you're on Sim, go full-tilt and take every setup. The next step is maintaining a journal. You must keep track of your performance; otherwise it's a waste of time. The other benefit you get is screen time. Screen time is KEY! Whether Sim or Real$; you're gaining screen time and that will improve your intuition and "market feel" over time. If you'd like feedback on your trading, start your journal online via a Blog (that's what I did). Read, read, and read some more! BUT question everything you read. Don't take the information as Fact. For example, 90-95% of the content posted on my Blog is my Opinion and Analysis. You can't accept it as fact. You must question any idea you come across and only accept it once you've performed your own testing/analysis, and internalized it based on your own personality. Really try to understand the concepts at their core. For example, if someone says "stay out of the market during the first 5-10 minutes of market open"; question yourself on WHY you should stay out of the market during that time? Formulate your own Logical answer that makes sense to YOU. If you decide to use a particular indicator, dig deep and understand how that indicator works (mathematically). A simple example is moving averages; if you're going to use moving averages, dig in and really understand what the moving average represents. Keep an open mind and never give your opinion so much weight that you can't change it. There's a fine line between having conviction in your trade idea, and being stubborn. If the market proves you wrong, you must be able to change your idea. Timing is critical in trading; you may think we're over bought/over sold, but if the market doesn't come to that conclusion at the same time as you, you must be willing to put that idea on hold, and trade what's in front of you.
Another great resource is Twitter and StockTwits.
It's getting really late here (past 3 AM now) so I'm going to wrap this up for now, but hope this post was useful to you. If you have any other questions or need clarification on something I wrote above, please post it in the comments. I'm writing this pretty late and hope the post makes sense (I'll review it in the morning).