Sunday, January 31, 2010

Monday 02/01/2010 - S&P 500 Futures Key Support/Resistance Levels

E-Mini S&P 500 Futures
After the heavy selling we saw last week, a technical bounce should not come as a surprise. We have an Open Gap below at 1061.75, which could act as a magnet. Historically, the first day of February is bullish, and Monday's have also been bullish lately. I'm anticipating range-bound activity during the morning session, followed by a trend developing into the afternoon session. I will be looking for Shorting opportunities in the Resistance Zones and Buying opportunities in the 1059.75-1062.50 Zone, and the other Support Zones below. My current bias is bullish going into tomorrow. Use Globex Low as Initial Support. Even better if Globex Low happens to be within my Initial Support Zone of 1066.25-1068. Trade well!

Econ Data
Personal Income and Outlays at 7:30 AM (cst), ISM Mfg Index and Construction Spending at 9:00 AM (cst).

ES - Daily Chart with Volume Profile and Key Levels

Saturday, January 30, 2010

My "Setup" or How I Enter a Trade

A question I'm frequently asked on the Blog is, "how do you enter the trade once price reaches your Key Area of Support/Resistance", or what "setups" I look for. Before I answer this question, I just want to put out the disclaimer that I'm in the learning stage myself, and what works for me, may not work for you.

The nightly preparation where I define the Key Levels to do business are an essential part of the setup. The chart I post every night is my Road Map for the following day, and even though I could trade without it, I would feel a little lost without the nightly preparation work. I already have scenarios in mind before price ever reaches those areas, and the scenarios are constantly being tweaked based on the latest market-generated information (price/volume). For example, if price reaches an Area of Resistance, my expectation is Rotation or a Pullback. Will price pull back 2 points, 5 points, or 20 points? I honestly don't know how much it will pullback, or whether it will pullback at all. But I anticipate enough of a pullback to allow me to move my stop-loss to break-even (generally stop is moved to break-even once price goes +6 ticks in my direction). Once price reaches my "pre-defined" Key Area, I don't have any specific "setup" -- all I look for is price to stall for a moment, and I'm in. If I hesitate, analyze or start looking for an elaborate "setup", price WILL move away from my ideal entry price, and I'll have to use a wider stop-loss to enter the trade (unacceptable to me). I am not an aggressive trader and I hate taking heat on my trades. I'm not trying to nail the top or bottom of the day, but I do try to nail the top or bottom of the current swing. I don't mind scratching trades because even my retail commissions are fairly low. Eventually I will either be working at a prop firm with member rates or will lease a seat at the CME, so I'm not worried about commissions.

ES 233 tick-bar Chart (Execution Chart)


I'll use a trade from Friday as an example and walk you through how little went through my mind when I entered this trade. The 233 tick-bar chart above illustrates the Trade. 1066.25-1068.75 was a pre-defined area of Support off the Key Levels chart posted the night before, so as soon as price reached that "area", I began looking for a Long opportunity off the 233 tick-bar chart (execution chart). Price built a small base at 1067.50, and I pulled up the DOM to execute the trade. I entered Long at 1068.25 when I saw the offers being lifted at 1068.25 -- I want my order to be one of the last few that gets executed at that price. That's all I looked at; and that was my "setup". Price quickly moved away from my entry and began building a base in the 1069.25-1069.75 area, and I moved my stop-loss to break-even (stress-free position now). Immediate resistance was the Globex Low at 1070.50, and I scaled ahead of that at 1070.25. 1074.75-1075.00 was stronger Resistance based on the 5-minute chart, and the final target should be around that Level. Once price broke above 1070.50, immediate resistance became immediate support, and the stop-loss was moved to 1070.25, locking in +2 points on the remaining position. Price moved up again and began building a base in the 1073.00-1073.50 area, and I scaled at 1073.25 because I didn't know whether price would base and move up, or rotate down. An important point to keep in mind is that, I don't know what's going to happen next, so I must manage the trade based on the information I do have. Price then pulled back to 1071.25, just one point away from my stop-loss. When price shot back up to 1074, and began building a base at 1073.25, I exited the position completely at 1073.25 due to the time of day (2:44 PM cst, nearing market close). The final target was 1074.25, ahead of that 1074.75-1075.00 Area of Resistance.

The main point to take away from this post is that I don't look for any elaborate "setups" once price reaches my area. It takes me a decent amount of time to prepare the nightly Key Levels, and what's the use of all the preparation if I'm going to look for 30 different confirmations before I enter the trade? The whole point of preparing the night before is to improve Execution; to make it almost automatic. I can't afford to over-analyze because that would require me to widen my stop. I'd rather get in at what I perceive to be the best price at the time, and then get stopped out at negative 4-6 ticks; than over-analyze and miss the trade completely.

If you're doing the preparation and homework ahead of time, you don't need elaborate "setups". Wait for price to get to your area of business, and then execute the trade. Whether you look for divergence on some oscillator, or NYSE TICK divergence, or something else -- it really doesn't matter, so long as the method gets you IN the trade. As an example, check out the following 1-min chart with NYSE TICK. I haven't looked at this chart in several months, but you can see how we had positive NYSE TICK divergence going into that 1067.50 Low.

ES 1-Minute Chart with NYSE TICK


In conclusion, my advice is to do the homework and preparation, analyze the overall context based on the day's action, and once price reaches your area of business, just focus on executing the trade. If you're a new trader, use a wider initial stop-loss to compensate for (lack of) precision.

I hope you found this post helpful. If you have any thoughts on this subject, please post in the Comments.

Friday, January 29, 2010

Friday 01/29/2010 - Euro FX Futures Review/Analysis

Euro FX (EUR/USD) Futures
I didn't have time to post the Key Levels for the 6E last night, but they worked out fairly well today. I scalped the 6E for a bit; but my main focus was the ES, which I believe had better price action today. Click on the 5-min Chart to see how the day played out in the Euro FX futures. Have a great weekend!

EC/6E 5-Minute Chart for 01/29/10

Friday 01/29/2010 - E-Mini S&P 500 Futures Review/Analysis

E-Mini S&P 500 Futures Review/Analysis
The Key Levels posted last night worked out beautifully today; pretty much to the tick. I missed the early morning action due to work, but managed to get Long at 1068 and traded the bounce on first touch. Click on the 5-min Chart to see how today's price action played out. Have a great weekend!

ES 5-Minute Chart for 01/29/10

Friday 01/29/2010 - S&P 500 Futures Key Support/Resistance Levels

E-Mini S&P 500 Futures
So far, we've seen Long Liquidation this entire week with technical bounces in oversold areas or areas of prior support. Now we're heading into some old areas of support here (remember 09' Thanksgiving, Dubai, etc). Obviously, the current trend is pointing down and the S&Ps continue to sell off overnight, but that could set up the stage for Responsive Buyers to come in tomorrow morning. Trade in direction of momentum, and use the Key Levels not only to initiate trades, but for targets as well. Use the increase in volatility to reach extended targets.

ES - Daily Chart with Volume Profile and Key Levels

Thursday, January 28, 2010

Thursday 01/28/2010 - Euro FX Futures Review/Analysis

Euro FX (EUR/USD) Futures
Starting to get a hang of the rotations in 6E. Overall, this contract trades very nicely. It's a relatively thin market so it overshoots Support/Resistance areas sometimes, but those are also good opportunities to get into a trade and scale out on the rotation.

EC/6E 5-Minute Chart for 01/28/10

Thursday 01/28/2010 - E-Mini S&P 500 Futures Review/Analysis

E-Mini S&P 500 Futures Review/Analysis
Some great setups in the ES today. I was busy with work most of the day and only executed two trade sequences: Long at 1076.75 on the pullback around 11:45 AM (cst), and then Short at 1086 near the end of day. I should have Shorted higher in the 1088 area as I posted on Twitter, but I was busy trading the 6E and can only focus on one instrument at any given time since I'm trading off a laptop.

ES 5-Minute Chart for 01/28/10

Wednesday, January 27, 2010

Thursday 01/28/2010 - Key S/R Levels (Brief)

Again, too busy with school and don't have time for a full post with charts.

E-Mini S&P 500 Futures
In the ES, the areas of Resistance are 1107.25-1109, 1114-1115.25, 1119-1122, and finally 1127. Areas of Support are 1090.50-1091.50, 1086-1088, and 1080-1082.

Euro FX (EUR/USD) Futures
In the 6E, overnight resistance is at 1.4043-4055, followed by 4072-4082, 4100-4110, 4145-4160.

Econ Data
Durable Goods Orders and Jobless Claims at 7:30 AM (cst), EIA Natural Gas Report at 9:30 AM (cst).

Wed. 01/27/2010 - E-Mini S&P 500 Futures Review/Analysis

E-Mini S&P 500 Futures Review/Analysis
Typical range-bound movement ahead of FOMC, followed by some range expansion on the announcement. I've been posting that 1080.50 area as Strong Support this entire week, and so far, that area has proven to be a great place to get Long.

ES 10-Minute Chart for 01/27/10

Wed. 01/27/2010 - Euro FX Futures Review/Analysis

Euro FX (EUR/USD) Futures
So far, I'm really liking the price action in 6E. It's a trader's market offering swift swings in both directions. I traded the 6E today, and the Key was to keep losses small (that's true of trading any market though). The instrument offers more than enough entries, so I just focused on keeping losses to a minimum and re-entering at the next setup. The rest took care of itself. Going forward, I'll definitely be focusing on 6E in addition to ES.

EC/6E 10-Minute Chart for 01/27/10

Tuesday, January 26, 2010

Wed. 01/27/2010 - No Key S/R Levels Tonight

No Key Levels post tonight due to too much homework and too little sleep. Anticipating range-bound action in the morning, and range expansion in the afternoon on the FOMC Announcement.

Econ Data
New Home Sales at 9:00 AM (cst), EIA Petroleum Status Report at 9:30 AM (cst), FOMC Meeting Announcement at 1:15 PM (cst).

Tuesday 01/26/2010 - E-Mini S&P 500 Futures Review/Analysis

E-Mini S&P 500 Futures Review/Analysis
We got the bounce I was looking for in that 1080-1086 area today. Other than that, I'm really liking the volatility and hope 20-30 pt daily ranges become the norm. Overall, some very nice moves in the market today with rotation in key areas. Check the annotated 10-min chart to see how the Levels played out.

ES 10-Minute Chart for 01/26/10

Tuesday 01/26/2010 - Euro FX Futures Review/Analysis

Euro FX (EUR/USD) Futures
Although I've only recently started looking into the 6E and have a lot more studying to do, the Key Levels are working out great here. Check the annotated chart to see how the Levels worked out today.

EC/6E 10-Minute Chart for 01/26/10

Monday, January 25, 2010

Tuesday 01/26/2010 - Euro FX Futures Key Support/Resistance Levels

Euro FX (EUR/USD) Futures

Econ Data
International
  • CHF UBS Consumption Indicator at 1:00 AM (cst)
  • EUR German IFO - Business Climate (JAN), EUR German IFO - Current Assessment (JAN), EUR German IFO - Expectations (JAN), EUR Euro-Zone Current Account n.s.a. (euros) (NOV) at 3:00 AM (cst)
  • GBP Gross Domestic Product (QoQ), GBP Gross Domestic Product (YoY) and GBP BBA Loans for House Purchase (DEC) at 3:30 AM (cst)

    U.S.
    Redbook at 7:55 AM (cst), S&P Case-Shiller HPI at 8:00 AM (cst), Consumer Confidence and State Street Investor Confidence Index at 9:00 AM (cst)

    EC/6E - Daily Chart with Volume Profile and Key Levels
  • Tuesday 01/26/2010 - S&P 500 Futures Key Support/Resistance Levels

    E-Mini S&P 500 Futures
    I feel we're due for a bounce here, but in the event that we don't get one, the resulting information will give us a clue as to how weak this market really is. So far, we're holding above that 1086-1088 area, and the plan is still to look for Buying opportunities in the 1080.50-1086 area. Below 1080, we could see a move to the 1060s. On the up side, the plan is to exit or scale out of Longs and begin looking for Selling opportunities in that 1109-1112 area.

    Econ Data
    Redbook at 7:55 AM (cst), S&P Case-Shiller HPI at 8:00 AM (cst), Consumer Confidence and State Street Investor Confidence Index at 9:00 AM (cst)

    ES - Daily Chart with Volume Profile and Key Levels

    Monday 01/25/2010 - Euro FX Futures Review/Analysis

    Euro FX (EUR/USD) Futures
    Last night was the first time I compiled Key Levels for the Euro FX futures, and overall, they worked out pretty well. The high on the Euro FX was just 3 ticks below the Resistance Zone. The initial support area around 4132 also held pretty well. Similar to the ES, the Euro remained range-bound within the Initial Balance for most of the U.S. day session.

    EC/6E 5-Minute Chart for 01/25/10

    Monday 01/25/2010 - E-Mini S&P 500 Futures Review/Analysis

    E-Mini S&P 500 Futures Review/Analysis
    The 1101-1103 area proved to be resistance on the day. As anticipated, price remained range-bound within the Initial Balance for most of the day. Majority of the volume occurred between 1096 and 1097. The range was pretty narrow, with the day session coming in at 9.75 points and the 24-hr session totaling just 13.25 points from High to Low. Range contraction leads to range expansion and vice versa, so expect some better price action tomorrow.

    ES 5-Minute Chart for 01/25/10

    Sunday, January 24, 2010

    Monday 01/25/2010 - Key Support/Resistance Levels (Euro FX Futures)

    Euro FX (EUR/USD) Futures
    I've started looking into the Euro FX Futures. The symbol for this contract is @EC in TradeStation and 6E (6EH0) in Infinity AT. I've just started studying this market so I'd appreciate any insights anyone provide about this instrument. Please post your experience and insights in the Comments section. If you have detailed insights you'd like to share, I could even add it to the Blog under it's own post.

    Econ Data
    EUR German GfK Consumer Confidence Survey at 1:00 AM (cst) and Existing Home Sales at 9:00 AM (cst).

    6E - Daily Chart with Volume Profile and Key Levels

    Monday 01/25/2010 - Key Support/Resistance Levels (S&P 500 Futures)

    E-Mini S&P 500 Futures
    The S&P 500 has suffered a 60+ point drop in three days; a bounce at this point should not be a surprise at all. 1086-1088 is a strong area of support, and we have the December Low at 1080.50 below that. I'm anticipating the 1080-1086 area to hold as support, and the plan is to look for Long opportunities there. At the same time, I am expecting rotation in the 1101-1103 area, and the 1109.50-1112 area and will be looking for Shorting opportunities there. Overall, I'm expecting a range-bound price action but with a bullish bias. Volatility is also coming back into the market, and the average daily range of the S&P is now around 20 points. As a result, we're also getting wider rotations, so the initial scale-out or profit target can also be increased.

    Econ Data
    Existing Home Sales at 9:00 AM (cst)

    ES - Daily Chart with Volume Profile and Key Levels

    Friday 01/22/2010 - E-Mini S&P 500 Futures Review/Analysis

    E-Mini S&P 500 Futures Review/Analysis
    I didn't have time to prepare the Key Levels for Friday. The numbers I posted on the Blog were significant levels I remembered from last year (1103-1104, 1094-1095, 1086-1088). We had a lot of activity in that 1086-1088 area last year, and rotation in that area was expected. Personally, I didn't think we would go all the way down to 1088 on Friday. I was expecting 1100 to hold as support, but that's why the Key Levels and Scenarios are simply a preparation aid. The scenario is then evaluated against real-time price action during the day, and revised if necessary. For example, after the first hour of trading was in, I posted the following on Twitter: "Based on the current profile, I'm working with two scenarios. Upward rotation to the 1119s OR a break of today's Lows into the 1090s". If you're a regular reader of this Blog, I would recommend you follow me on Twitter as well. The Blog is used for preparation and review, and Twitter is used for real-time market thoughts. Following both will provide a complete picture of how I view the markets.

    ES 5-Minute Chart for 01/22/10

    Thursday, January 21, 2010

    Friday 01/22/2010 Key S/R Levels (S&P 500 Futures)

    Have too much work and too little sleep, so no Key Levels tonight. I'm not expecting a big down day tomorrow, and am anticipating the 1103-1104 area to hold as support; below that we have 1099 and 1094. On the upside, anticipating resistance at 1116.75, 1119.50, 1122.25 and 1125.25. The plan would be to short the pops at or near Resistance.

    Thursday 01/21/2010 - E-Mini S&P 500 Futures Review/Analysis

    E-Mini S&P 500 Futures Review/Analysis
    Today's scenario is something I've been anticipating since last week. That's why I was surprised on Tuesday when ES broke 1127 and ended up bouncing to 1146+. Today's price action was great: rapid but structured price movement, with bounces to prior support -- I wish we had more days like today (in both directions).

    ES 5-Minute Chart for 01/21/10

    Wednesday, January 20, 2010

    Key Support/Resistance Levels (S&P 500 Futures) for Thursday 01/21/2010

    E-Mini S&P 500 Futures
    I'm looking for a break out of this range (1125-1148); doesn't matter if it's to the upside or downside. If we make it back to 1145+, I would anticipate a test and extension of this year's high (1148). The other scenario is a clean break to the downside. And of course, we could just consolidate in the range as well. My near-term bias is bullish above 1130.

    Econ Data
    Jobless Claims at 7:30 AM (cst), Leading Indicators and Philadelphia Fed Survey at 9:00 AM (cst), EIA Natural Gas Report at 9:30 AM (cst),
    and EIA Petroleum Status Report at 10:00 AM (cst).

    ES - Volume Profile and Upside Key Levels


    ES - Volume Profile and Downside Key Levels

    Wed. 01/20/2010 - E-Mini S&P 500 Futures Review/Analysis

    E-Mini S&P 500 Futures Review/Analysis
    At first glance, the recent price action in the S&Ps may signal weakness, but I'm not so sure. If this market was truly weak, I don't think we would be getting bounces in the 1125-1126 area. A truly weak market would have flushed down further, IMHO. I could be completely wrong, but these bounces make me think there's still some life in this market. We'll see...I'm going to try to remain neutral until the market gives us some clear direction out of this area.

    ES 5-Minute Chart for 01/20/10

    Key Support/Resistance Levels (S&P 500 Futures) for Wed. 01/20/2010

    Too many other items on my plate, so no Key Levels post tonight.

    Econ Data
    Housing Starts and Producer Price Index at 7:30 AM (cst). Redbook at 7:55 AM (cst)

    Tuesday, January 19, 2010

    Tuesday 01/19/2010 - E-Mini S&P 500 Futures Review/Analysis

    E-Mini S&P 500 Futures Review/Analysis
    I know I'm not the only one who was surprised by the unusually strong up move today. I was not anticipating such a strong up move, but was open to the idea. I posted last night that my "process goal will be to keep the personal bias in check, and keep my mind open to bullish scenarios as well." That thought alone kept me out of trouble today. One way I gauge momentum and strength of bulls/bears is by measuring the range of the up/down rotations. As you can see from the 5-min chart, the rotations in the overnight session were favoring the bears with upward rotations averaging around 1.25 points and downward rotations averaging 2.25 points. This relationship reversed when ES pushed from 1127.50 (7:20 AM cst) to 1132.75 (7:40 AM cst). Price also remained above the mid-point and VWAP right from the cash open; another sign that Bulls were in control.

    ES 5-Minute Chart for 01/19/10

    Monday, January 18, 2010

    Key Support/Resistance Levels (S&P 500 Futures) for Tuesday 01/19/2010

    E-Mini S&P 500 Futures
    My bias is bearish below 1137.75, neutral between 1137.75 and 1142 and cautiously bullish above 1142. So far, the price action is turning out to be very similar to MLK day 2006. If that's any indication, we could see much lower prices over night and into the morning session. I'll be looking towards the Globex Low to provide some support at the cash open, and will then key off the over-night mid-point as near-term resistance. Although my current bias is bearish, I have to recognize the fact that 1129.50 was rejected over the short holiday session, and ES has continued to build value above 1134. Tomorrow's process goal will be to keep the personal bias in check, and keep my mind open to bullish scenarios as well.

    Econ Data
    Treasury International Capital at 8:00 AM (cst), State Street Investor Confidence Index at 9:00 AM (cst), and Housing Market Index at 12:00 PM (cst).

    ES - Daily Bar Chart with Volume Profile and Key Levels

    Friday, January 15, 2010

    Friday 01/15/2010 - E-Mini S&P 500 Futures Review/Analysis

    E-Mini S&P 500 Futures Review/Analysis
    As I posted last night, the 1141 level was my Line in the Sand to establish directional bias, and it served me well today. My bias was bearish at the open because price had broken down through 1141 as well as Initial Support in overnight trade, and the cash open at 1143 was below previous day's close and in the middle of yesterday's Initial Balance. A break of the 1139.75-1141 area confirmed that sellers were in control. Price also pushed right through the 1135-1137 Support Zone, which was also a sign of aggressive sellers and more selling to follow. Price finally stabilized around 1128.50 (strong support), but only after stopping out the traders who got Long too early in hopes to catch the bottom. It was much better and easier on the nerves to wait, buy the pullback, and trade the rotation back to the IB Low -- I posted this setup/scenario on StockTwits at 12:58 PM (Eastern). Given the weak close below the Initial Balance Low, we could see some continued selling into the next trading session.

    Hope you all did great today! I'm off to the Chicago Premier of FLOORED. Have a good weekend!

    ES 5-Minute Bar Chart for 01/15/10

    Thursday, January 14, 2010

    Key Support/Resistance Levels (S&P 500 Futures) for Friday 01/15/2010

    E-Mini S&P 500 Futures
    I will continue to use 1141 as Line in the Sand to establish directional bias; bullish above and bearish below it. As long as we remain above 1141, I'm anticipating a test of 1150.50, followed by a pullback. Beyond 1150.50, I would expect a test of 1155.25, and finally the 1159 area. 1128 is still the Big # below, although we now also have some firm support in the 1135-1136 area as well. The estimated daily range for tomorrow is 13.50-17.75 points.

    Econ Data
    Consumer Price Index and Empire State Mfg Survey at 7:30 AM (cst), Industrial Production at 8:15 AM (cst), and Consumer Sentiment at 8:55 AM (cst).

    ES - Daily Bar Chart with Volume Profile and Key Levels

    Thursday 01/14/2010 - E-Mini S&P 500 Futures Review/Analysis

    E-Mini S&P 500 Futures Review/Analysis
    I wasn't expecting such a narrow range day (8.75 points from Low to High). Only consolation is that narrow range days are typically followed by wide range days. I was using the 1141 level as Line in the Sand to establish directional bias (bullish above, bearish below). Most of the volume today was above 1141, and that level is still "in play". I was Long at 41.75 and exited in the 1145.25 area ahead of the IB High. We got a rotation back to the Initial Balance off the Initial Resistance Zone near the close.

    ES 5-Minute Chart for 01/14/10

    Key Support/Resistance Levels (S&P 500 Futures) for Thursday 01/14/2010

    E-Mini S&P 500 Futures
    As long as tomorrow's Econ releases don't throw off the current upside momentum, my bias will remain bullish above 1141. If we start moving higher, price could slice right through the Initial Resistance Zone without a retrace. On the downside, I'm anticipating a pause and rotation in the Initial Support Zone, followed by a pause in the 1128.50-1130.50 area. If that area breaks, we could see heavy selling. My scenario for tomorrow is anticipating a wide initial balance. If we're trading above the initial balance in the afternoon, I'm anticipating a return to balance prior to the close. If we break 1127, I would expect a trend day to the down side. Please note that this is just a scenario/framework, and actual trades will be based on reading price in real-time.

    Econ Data
    Retail Sales, Jobless Claims and Import and Export Prices at 7:30 AM (cst), Business Inventories at 9:00 AM (cst) and EIA Natural Gas Report at 9:30 AM (cst).

    ES - Daily Bar Chart with Volume Profile and Key Levels

    Wednesday, January 13, 2010

    Wed. 01/13/2010 - E-Mini S&P 500 Futures Review/Analysis

    E-Mini S&P 500 Futures Review/Analysis
    The Key Levels provided excellent trade location today for entries and exits (I was Long at 1130.25 in the morning and Short at 1145.00 in the afternoon). Responsive Buyers came in as price approached the 1128 area, and quickly returned price to the Initial Balance High. After consolidating in the 1138.50-1141 area for a couple of hours, ES broke out again to the upside and filled the open gap at 1142.50, followed by running into the Initial Resistance Zone. Despite some profit taking in the last 20 minutes of the session, price closed strong above the Value Area and IB High. Based on the strong close, I'm anticipating continued upside into tomorrow's session as long as price remains above 1141 (note: tomorrow morning's Econ Releases could throw this scenario off).

    ES 5-Minute Chart for 01/13/10

    Tuesday, January 12, 2010

    Key Support/Resistance Levels (S&P 500 Futures) for Wed. 01/13/2010

    E-Mini S&P 500 Futures
    As long as we stay above 1132, I would anticipate consolidation in the 1132-1145 area. We've bounced off that 1127-1128 area three days over the last week, and my level of confidence in that support zone holding is running Low now. If we break 1132, and move down to the 1127-1128 area again, there's a higher probability that we'll get a break and flush down to the 1123 area, followed by a test of the 1119 area. My bias is bullish above 1132, neutral to bearish below 1132, and bearish below 1127. We have an open gap at 1142.50 above, followed by a strong resistance zone in the 1145-1146.25 area. Trade well!

    Econ Data
    EIA Petroleum Status Report at 9:30 AM (cst), Beige Book and Treasury Budget at 1:00 PM (cst).

    ES - Daily Bar Chart with Volume Profile and Key Levels

    Tuesday 01/12/2010 - E-Mini S&P 500 Futures Review/Analysis

    E-Mini S&P 500 Futures Review/Analysis
    The Key Levels posted last night provided great trade location today. You made out quite well even if you blindly went Long at the Support Zones and Shorted the Resistance Levels. That 1127-1129 was a "must-buy" area on first touch. 1128.50 is an important High Volume node on the larger time-frame. If you didn't go Long around 1128, you have to ask yourself "what was the risk?" -- the answer is 2 points, tops! Check out the annotated chart to see how the levels played out.

    ES 5-Minute Chart for 01/12/10

    Monday, January 11, 2010

    Key Support/Resistance Levels (S&P 500 Futures) for Tuesday 01/12/2010

    E-Mini S&P 500 Futures
    After the weak close below the mid-point today, it's no surprise that we're seeing the same theme continue into the overnight session. 1142.50 is the near-term overnight resistance, and we have a stronger resistance zone above that (1144.25-1146.25). Below, we have strong support in the 1136.50 area, and I'm anticipating a bounce on first touch. Same goes for the 1131.50 and 1127.50 areas; anticipating price to pause/bounce in those areas. My bias is bearish below 1146.25, neutral between 1146.25 and 1148 and cautiously bullish above 1148 with an eye to the upside resistance zones to exit Longs or initiate Shorts. If we get a sell-off tomorrow, watch the 1127-1129 support area -- If that breaks, I'm anticipating heavier liquidation.

    Btw, I want to clarify that the purpose of the Key Levels is NOT to Predict future price action! The Levels serve as a sort of Road Map and provide low-risk areas to initiate and exit trades. That's it! I'm not in the Prediction business; and predicting can actually be detrimental to your P&L since you run the risk of defending your prediction instead of analyzing and responding to the Market in real-time. I don't care if the market goes up or down tomorrow; I have no vested interest either way, but I'm prepared to trade it in either direction.

    Econ Data
    International Trade at 7:30 AM (cst), Redbook at 7:55 AM (cst).

    ES - Daily Bar Chart with Volume Profile and Key Levels
    S&P Key Levels

    Monday 01/11/2010 - E-Mini S&P 500 Futures Review/Analysis

    E-Mini S&P 500 Futures Review/Analysis
    The 1148-1148.75 area I posted on Twitter last night worked out great. We got a bounce on first touch of the Initial Support Zone. Price never reached the Strong Support Zone, and instead double-bottomed ahead of that area, and managed to retrace above the mid-point but closed right under it (sign of weakness). I'm also continuing to see weakness in the other indexes, so will be careful on the Long side until ES closes above 1148.

    ES 5-Minute Chart for 01/11/10 Includes Overnight Globex

    Sunday, January 10, 2010

    Key Support/Resistance Levels (S&P 500 Futures) for Monday 01/11/2010

    E-Mini S&P 500 Futures
    So far, we've seen a push into the 1147 area in overnight trade, which means price is already quite extended. 1152.50 is a 100% extension of Friday's range. Above 1152.50, 1154 is also resistance. I'm anticipating a pullback either overnight or tomorrow morning, but will only consider fading this move at the extensions (1148.25, 1150.50, 1152.50). We have plenty of support levels on the way down, and as usual, I'm anticipating pause/rotation in the Strong Support Zones. Advice for tomorrow: set your biases aside and trade what's in front of you!

    ES - Daily Bar Chart with Volume Profile and Key Levels

    Friday 01/08/2010 - E-Mini S&P 500 Futures Review/Analysis

    E-Mini S&P 500 Futures Review/Analysis
    Friday was not an easy day to trade and there was a lot of chop in the middle of the day. Despite the lack luster price action, the Scenario and Key Levels played out pretty well. I estimated a 9-12 point reactionary swing at the NFP release, and the Low to High on the NFP reaction came in at 8.25 points. I also mentioned that the IB High/Low is typically set very close to the cash opening price. On Friday, the ES regular trading hours open was at 1134.50, and the IB Low was set 15 minutes later at 1132. We got a strong rejection of the 1132 area, and price ended up retracing up and closing in the Initial Resistance Zone. The fact that this market rallies on bad news should be a tell tale sign of a bull or at least bullish market.

    ES 5-Minute Chart for 01/08/10 Includes Overnight Globex

    Thursday, January 7, 2010

    Key S/R Levels (S&P 500 Futures) for Friday 01/08/2010 (Nonfarm Payrolls)

    E-Mini S&P 500 Futures
    The Nonfarm Payrolls data comes out tomorrow morning at 7:30 AM (cst), and NFP days behave in a certain way. First thing you should do is look at past NFP days to get an idea of the typical "behavior". Check the following links for last month's posts for the NFP release:
    NFP days typically consist of two moves; a swing in one direction (reaction) followed by a swing in the other direction. Momentum is high, so be careful fading momentum unless price is at an extreme. Another important point to keep in mind is that typically the Initial Balance High/Low is put in place right around the Cash Open (8:30 AM cst). The typical reactionary swing is 15 points or so; but with the reduced volatility, I'm anticipating a 9-12 point reactionary swing (just an estimate). The Key Levels still apply, but I would look at where price is trading at 7:30 AM, and then rely on a Support/Resistance Zone 9-12 points away from that level. 1127-1128 has been a heavily accepted area over the last week. If that level breaks, we could see some fast liquidation down to the 1118-1119 area.

    Econ Data
    Employment Situation / Nonfarm Payrolls at 7:30 AM (cst) and Wholesale Trade at 9:00 AM (cst).

    ES - Daily Bar Chart with Volume Profile and Key Levels

    Thursday 01/07/2010 - E-Mini S&P 500 Futures Review/Analysis

    E-Mini S&P 500 Futures Review/Analysis
    I received a few Thank You messages today from traders who used the Key Levels & Scenario from last night and got great trade location. Just want to say You're Welcome, and I'm glad you all banked some profits today. Knowing that others are benefiting from this information makes it worthwhile to post on here.

    My bias was bullish above 1127, and that level held in overnight trade as well as the day session. 1132.50 was posted as the Overnight Resistance, and that worked out to the tick, with the IB High being set at 1132.50. The 1135 resistance level also worked to the tick and ES pulled back 2.50 points on first touch. It took a few attempts to make it through that area. ES also pulled back 4 points from the Range Extension Zone and put in a strong close at 1137.75.

    Nonfarm Payrolls out tomorrow at 7:30 AM (cst). Key Levels post coming later tonight.

    ES 5-Minute Chart for 01/07/10 Includes Overnight Globex

    Key Support/Resistance Levels (S&P 500 Futures) for Thursday 01/07/2010

    E-Mini S&P 500 Futures
    ES managed to build value higher again today, but I'm continuing to see signs of weakness among the other indexes, and am cautious on the Long side. My bias is bullish above 1129, neutral to slightly bullish above 1127 and bearish below 1127. I'm anticipating 1138 to act as a resistance level tomorrow if price manages to get there, and the plan would be to look for a short entry on first touch. Aside from that, anticipating rotational moves and a range-bound market ahead of the Nonfarm Payrolls due Friday morning.

    Econ Data
    Jobless Claims at 7:30 AM (cst) and EIA Natural Gas Report at 9:30 AM (cst).

    ES - Daily Bar Chart with Volume Profile and Key Levels

    Wednesday, January 6, 2010

    Wed. 01/06/2010 - E-Mini S&P 500 Futures Review/Analysis

    E-Mini S&P 500 Futures Review/Analysis
    As mentioned in last night's post, my bias was bullish above 1127, and ES double-bottomed at the overnight Low of 1127.25. From there, ES made rotational moves up into the Initial Resistance Zone and had a lot of trouble getting through that area. After pulling back several times off the Initial Resistance Zone, ES finally made it to the Range Extension area, and pulled back again. I traded both Long and Short, at or near the Key Levels. I also made sure I was buying on pullbacks since I was cautious on the Long side.

    ES 5-Minute Chart for 01/06/10 Includes Overnight Globex

    Tuesday, January 5, 2010

    Key Support/Resistance Levels (S&P 500 Futures) for Wed. 01/06/2010

    E-Mini S&P 500 Futures
    The other indexes (YM, NQ, and TF) are showing signs of weakness, which at the very least, calls for some caution on the Long side. Holding the 1123 area on any push down is fairly important for the Bulls. I'm anticipating a bounce in the 1123-1125 area on first touch, due to nervous Bears covering their positions and over-confident Bulls adding to their Long positions. A break of that 1123 support could take us to the 1118-1120 area in a hurry. Bias is bullish above 1127; neutral to bullish above 1123 and bearish below 1122.

    Econ Data
    ADP Employment Report at 7:15 AM (cst), ISM Non-Mfg Index at 9:00 AM (cst), EIA Petroleum Status Report at 9:30 AM (cst), and FOMC Minutes at 1:00 PM (cst).

    ES - Daily Bar Chart with Volume Profile and Key Levels
    ES Key Support/Resistance Levels

    Tuesday 01/05/2010 - E-Mini S&P 500 Futures Review/Analysis

    A quick shout out to StockTwits for including my Key Levels post from last night in their Chartly Technical Knockout morning newsletter! Thanks guys, appreciate it!

    E-Mini S&P 500 Futures Review/Analysis
    The Key Levels and Scenario worked beautifully today. Last night's post called to short the Initial Resistance (1130-1132) on first touch and go Long at Initial Support (1123-1125) on first touch, and those were the best trades of the day. Although today's 8-point range was well below the average, ES managed to build value above 1127 on higher volume than yesterday, which is reassuring for the bulls. At the same time, any move below 1125-1127 puts the short-term Buyers in a losing position. Just the like the Bears, the Bulls will most likely add to their position on the first push down to 1123, but any subsequent swing down below 1123 could result in some liquidation. Bias is bullish above 1127; neutral to bullish above 1123 and bearish below 1122.

    ES 5-Minute Chart for 01/05/10 Includes Overnight Globex
    ES 5-minute Chart

    Monday, January 4, 2010

    Key Support/Resistance Levels (S&P 500 Futures) for Tuesday 01/05/2010

    E-Mini S&P 500 Futures
    Today's run up indicates a strong push by the other time-frame buyer, and so far buyers are in control in the overnight session as well. I'm anticipating consolidation or minor range expansion to the upside tomorrow. The average range estimate is 12-16 points. When a market is consolidating, I look to fade the moves into support/resistance, which means I'll be looking to short around 1132-1133 on first touch, again in the 1135-1137 area and finally in the 1140-1142 area. By the same principle, I'll be looking to go Long in the 1123.25-1125 area on first touch, and again in the 1118 and 1112 areas. Read the price action in real-time and enter if an entry within your risk parameters presents itself.

    Economic Data
    Redbook at 7:55 AM (CST), Factory Orders and Pending Home Sales Index at 9:00 AM (CST)

    ES - Daily Bar Chart with Volume Profile and Key Levels

    Upside Key Levels
    Volume Profile Chart with Key Levels

    Downside Key Levels
    Volume Profile Chart with Key Levels

    Monday 01/04/2010 - E-Mini S&P 500 Futures Review/Analysis

    E-Mini S&P 500 Futures Review/Analysis
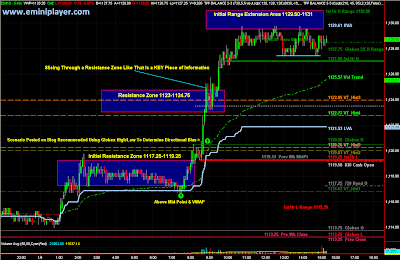
    Today's 19 point range is well below the average, but ES still managed to tag the Initial Range Extension Zone. The bias was Long above the Globex High, and that played out well. If you did not trade on the Long side today, I would recommend you make a critical assessment of your personal bias. From a structural stand-point, a Short trade did not set up at any point throughout the day. Structurally, the up trend remained strong, and Shorts (if any) were *scalps* only.

    Today's wide-range day could result in some additional consolidation in the 1120-1129 area. I'm anticipating continuation of the up-trend into tomorrow, and bias is bullish above 1123.

    ES 5-Minute Chart for 01/04/10 Includes Overnight Globex
    ES 5-minute Chart

    Key Support/Resistance Levels (S&P 500 Futures) for Monday 01/04/2010

    First of all, welcome to 2010 and I wish everyone the best!

    Just an FYI -- tomorrow is the beginning of my last quarter at school, and I'm enrolled in five classes! This is in addition to a full-time job, so my schedule will be pretty crazy. I'm not sure if I'll be able to post the Key Levels and Scenarios every night, but will try to keep up with it. I graduate in March :)

    E-Mini S&P 500 Futures
    I'm anticipating a wide-range volatile trading day tomorrow. The average range of the first session of the year is 29.75 points, which means if we break out, we could tag the 1135-1142 area, and if we sell off, we could easily see the 1094s or even 1086s tomorrow. I'm anticipating a strong trend swing in the afternoon session. Please note that just because price has behaved a certain way in the past does not mean it WILL behave similarly tomorrow, but we can anticipate and prepare for the moves. Trades should be taken based on real-time market generated information.

    The range expansion potential is pretty strong so I had to take two snapshots of the Key Levels chart to show the upside and downside support/resistance areas. I'd love to elaborate more on my thoughts for tomorrow, but it's already past 12:30 AM and I need to be up in 5 hours. Use the Overnight (Globex) High/Low to determine bias during the day session.

    ISM Mfg Index and Construction Spending data out at 9:00 AM (CST) tomorrow morning. Trade well!

    ES - Daily Bar Chart with Volume Profile and Key Levels

    Upside Key Levels


    Downside Key Levels