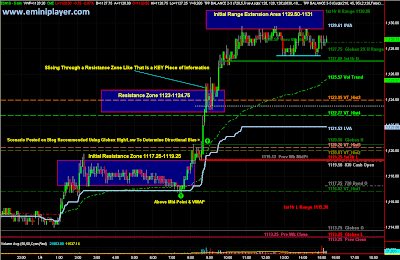
Today's 19 point range is well below the average, but ES still managed to tag the Initial Range Extension Zone. The bias was Long above the Globex High, and that played out well. If you did not trade on the Long side today, I would recommend you make a critical assessment of your personal bias. From a structural stand-point, a Short trade did not set up at any point throughout the day. Structurally, the up trend remained strong, and Shorts (if any) were *scalps* only.
Today's wide-range day could result in some additional consolidation in the 1120-1129 area. I'm anticipating continuation of the up-trend into tomorrow, and bias is bullish above 1123.
ES 5-Minute Chart for 01/04/10 Includes Overnight Globex

Hi,
ReplyDeleteHow do you define your range extensions? I see 127, 138, 161, 200. Are you using fib extensions from the range of the previous day? Also, I don't understand what the VT Hist 1,2,3, etc are. Are they previous value areas? Thanks for your insite, most helpful@
Yes, they're Fib extensions of the previous day's range. Simply setup your Fibonacci Retracement to plot 127.2, 138.2, 161.8 and 200%; then take TWO measurements: one from the previous day's High to Low, and another from the previous day's Low to High to get the extensions on both sides of the range.
ReplyDeleteVT Hist 1, 2, 3, etc. are the Closing VWAPs from 1, 2, 3 days ago.
Hope that helps!