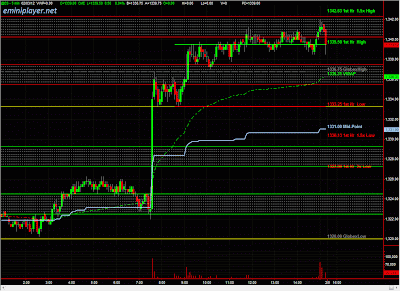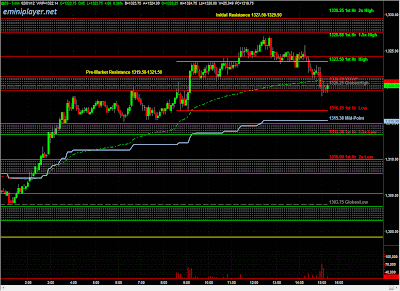
View full size chart
My views on trading the E-Mini S&P 500 Futures utilizing Price Action, Market Structure, Volume/Market Profile and the Auction Market Process. Visit www.EMiniPlayer.net for Daily Key Support/Resistance Zones, Trade Plan and Educational Recaps.
E-Mini S&P 500 Futures
ES held above the 1365.50 Support in the overnight session, and tested the 1372-1374 Resistance where it found Responsive Sellers capping the upside. Heading into the day session, we'll be using 1367.50 as the Micro Bull/Bear Line in Sand as a gauge to see which side is being more aggressive; holding above 1367.50 would indicate Buyers in Control, and holding below would indicate weakness on the Buy side (not necessarily Sellers in Control). We have Initial Support at 1364-1366, followed by the Bull/Bear Zone at 1359.25-1361.25 -- the overall bias remains bullish above that area. On the upside, we have Pre-Market Resistance at 1372-1374 followed by Initial Resistance at 1377.25-1379.25. A pullback off the open would indicate a higher probability of a Balanced Session, with Responsive Sellers active at Resistance and Responsive Buyers active at Support. The primary catalyst during the day session is Consumer Confidence at 9 AM (CT). Use the Opening Range and 1367.50 for short-term bias off the open.
Econ Data
Durable Goods Orders at 7:30 AM (CT), Redbook at 7:55 AM (CT), S&P Case-Shiller HPI at 8:00 AM (CT), Consumer Confidence, Richmond Fed Manufacturing Index and State Street Investor Confidence Index at at 9:00 AM (CT).
Webinar/Live Trading Room: Join us for free at http://bit.ly/z3cmTo
E-Mini S&P 500 Futures
The upside move that began yesterday morning, continued in the overnight session and ES tested the 1368-1369.50 Resistance Zone. Heading into the day session, we have Pre-Market Resistance at 1366.50, followed by Initial Resistance at 1368-1369.50. Above 1369.50, we have Resistance at 1372-1374 followed by 1377.25-1379.25 (Buying could shut off there). On the downside, we have Initial Support at 1359-1361 (previous VPOC 1359.25), followed by the Micro Bull/Bear Zone at 1355-1357, which we use to establish directional bias (bullish above 1355, bearish below it). Given the overall Bullish context, the expectation is for Responsive Buyers to be active at every Support Zone, and the Selling could shut off by 1355-1357. A break and hold below 1355 would be a red flag for Buyers. With two econ reports out in the first half hour, the expectation is for a range-bound/choppy open with Responsive Sellers active at Resistance, targeting the gap fill at 1363.
Econ Data
Consumer Sentiment at 8:55 AM (CT) and New Home Sales at 9:00 AM (CT).
E-Mini S&P 500 Futures Trade Plan
Overnight, ES balanced within yesterday's 24-hr range, building Acceptance at 1357. Heading into the day session, we have the Micro Bull/Bear Zone at 1354.25-1356.25 (gap fill at 1356), followed by 1353 (minor support) and Initial Support at 1348-1351. On the upside, we have Pre-Market Resistance at 1358.75-1360.25, followed by Initial Resistance at 1363.75-1365.75 and then 1368-1369.50 (top of the current range on 24-hr chart). So far this week, we've seen Consolidation of last week's upside break-out, and ideally, price should hold above the 1354.25-1356.25 Micro Bull/Bear Zone and then break above the 1358.75-1360.25 Resistance for Buyers to remain in Control. Given the overall Bullish Context, the expectation is for Responsive Buyers to be active at Support. The only thing that would caution us against Longs at Support would be an Open Drive to the downside, and Market Internals indicative of a Trend Down day. Otherwise, we'll be looking for Responsive Buyers at Support and use the Resistance Zones as upside targets. With no market-moving economic catalyst during the day, we could get a Balanced session (upside cap in the event of breakout: 1368-1369.50, downside cap in the event of liquidation: 1348 or 1343-1345).
Econ Data
Jobless Claims at 7:30 AM (CT), FHFA House Price Index at 9:00 AM (CT), EIA Natural Gas Report at 9:30 AM (CT), EIA Petroleum Status Report at 10:00 AM (CT), Kansas City Fed Manufacturing Index at 10:00 AM (CT), and 7-Yr Note Auction at 12:00 PM (CT).


