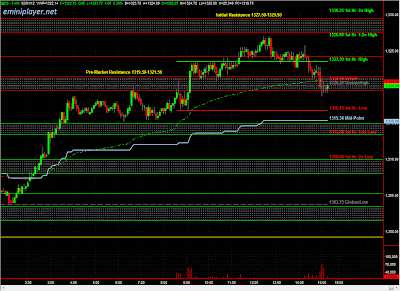
Overnight, we were using 1305 as the Micro Bull/Bear Line in Sand to establish directional bias -- Responsive Buyers shut off the Selling a tick ahead of the 1303.50 Support and quickly rejected prices below 1305. Yesterday's review/analysis post also mentioned that we'd be looking for a strong directional move away from 1308, and the break & hold above 1308 took ES up to the 1319.25-1321.25 Resistance Zone, which capped the upside overnight. Heading into the day session, we have Pre-Market Support at 1313-1315 and Pre-Market Resistance at 1319.50-1321.50. With the strong upside move overnight, the expectation is for Buyers to be active at Support and test the NVPOC at 1319.50, followed by 1324.25 and potentially 1327.50-1329.50 (top of Balance Area). Holding above 1313-1315 would indicate short-term Initiative Buyers active in the market, increasing the probability of testing 1324.25. The expectation is for Responsive Sellers to be more active at Resistance above 1324.25. On the downside, below 1313, Key Support is at 1308-1310. Buyers remain in Control. The primary economic catalyst this morning is the ISM Mfg Index at 9 AM (CT). ES is set to open above Value.
5-min Chart with EMiniPlayer.net Support/Resistance Zones

View full size chart
a little late for this post?
ReplyDeleteIt was posted at 8:06 AM on http://www.eminiplayer.net -- I post it here, on the free blog, after market close.
ReplyDelete